

Investment Readiness: How to master your market opportunity
19th September 2019
Investment Readiness is the process of getting your business into a position where it’s ready to raise money from banks, lenders, investors and institutions, and it’s a key part of our Perfect Pitch service.
For a business to be “investment ready” it typically means they’ve got all the documents and completed all the research, they need to impress investors – giving them the very best chance of a successful raise.
An investment-ready business will have covered key criteria such as developing robust financial projections, testing and proving their concept, refining their target market, considered their customer acquisition strategy and more besides. This is typically documented in a business plan or pitch deck.
When we help our clients articulate their business case in an investor-friendly way, we often find that one of the weakest area’s is around the Market Opportunity for their venture. It’s so tempting to focus effort on building a great solution, gaining some initial traction and establishing financial projections, that businesses fail to put in the effort needed to prove they have a market that can support their claims.
The importance of detailing your market opportunity
Defining your market opportunity is vital. It’s one of the main things that helps you validate your financial projections and your valuation in the eyes of the investor. Its purpose is to demonstrate you have researched the market in which you operate, have considered its size and validity, and to showcase the following things:
- The market is big enough to support your business
- The market is stable or growing and not declining
- The market can easily sustain the revenue predicted in your financial plan
For example, it’s unlikely that you can state, in all good conscience, that you’ll turn over $500m per year by year 5 if the total market size is currently $200m and growing at 5% per annum. In 5 years, the market will be worth around $250m. So, you’d have to single-handedly double the size of the market while also growing and establishing a business that destroys the competition to the extent that it has a 100% share of the market. A tough ask for any entrepreneur.
While this is an extreme example, it’s something we see all too often. When doing your financial projections, it’s easy to input your customer growth way beyond that of what your market can support. Therefore, to be investment-ready, you must do diligent market research and use this as the basis for validating your financial projections and growth planning.
The two core approaches for how to showcase your Market Opportunity
There are two core approaches entrepreneurs should take when trying to express their market opportunity to investors.
The first is what we like to call Market Opportunity Evidence which is where you provide a collection of facts about your market that looks to support your claim that your business has massive potential by operating in a large, highly valued and growing market. Most typically, this approach takes the form of a collection of top-level market stats from a range of industries that are closely related to your own.
The second approach is TAM, SAM and SOM (we’ll explain the acronym later). This approach attempts to explain to an investor the share of the market you realistically expect to capture and will need to gain to meet your financial targets. It drills down into the top-level market figures to give a more considered prediction of your market share.
How to research your Market Opportunity Evidence
For most businesses, this can be relatively straight forward. Google’s is your best friend here, along with websites such as statista.com, crunchbase.com and blogs such as Forbes and Entrepreneur.
The main objective here is to paint a realistic picture of the market you operate in. Key figures to search for are the current market size and the future market size. Try to find stats that support your growth plan. For example, if you plan to trade only in the UK, don’t use US or global market size statistics.
Sometimes, your market spans a couple of area’s in which case you may show the market size (or future market value) of a couple of different industries or sectors.
TOP TIP: rather than just settle for the first stat you find, keep searching for other sources that contradict or support your argument. Try to be objective and not emotional by picking the stats that seem most reliable over those that are most impressive.
Occasionally, there are no figures that are directly related to your industry – perhaps you’re in a new sector, or you’re in a niche of a sector and as such the available stats are not focused and relevant enough.
If this is the case, you may find that you’ll need to conduct primary research into your market opportunity. What this entails will ultimately depend on your business model and sector. It may take longer than secondary research, but it will be much more powerful.
Think clearly about what you are trying to prove and devise a research project that will help you prove it. If you can get a large enough sample, and the research method is well thought out, then you’ll be in a good position to make assumptions as to how things will play out at a national and global scale.
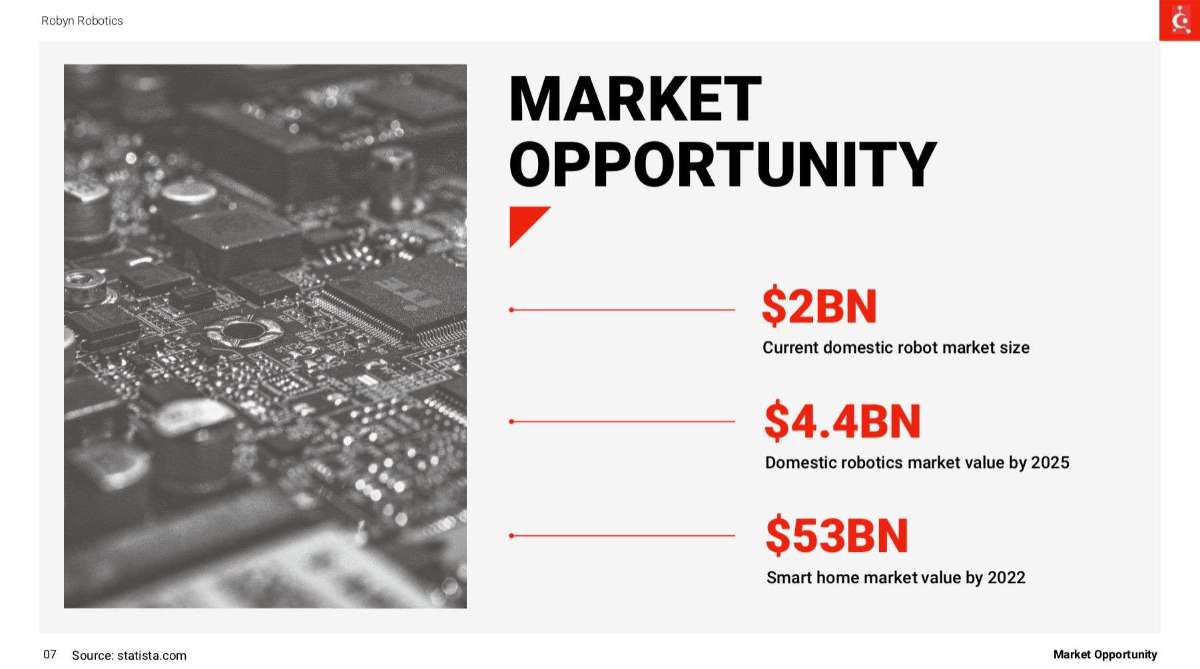
Here’s an example of how your Market Opportunity slide may look with a good and well researched Market Opportunity Evidence approach.
How to produce your TAM, SAM and SOM
TAM, SAM and SOM is a much more robust way of proving your market opportunity. This too can be relatively straight forward, if you know what you are doing.
First, let’s look at defining the terms TAM, SAM and SOM.
TAM – Total Addressable Market
This is the value of the entire market or total possible demand for your product. It could be a monitory value, the number of users or the size of the audience. This is often the worldwide figure.
SAM – Serviceable Addressable Market
This is a proportion of the TAM figure. It’s the market value or the number of users you can reach with your product. It’s often limited by geography or demographic.
SOM – Service Obtainable Market or Share of Market
This is a proportion of the SAM figure. It’s the number you can realistically acquire with your product or service. It’s your realistic, short-term target.
Here’s an example:
You’re introducing a new lager to the global market. Your TAM is anyone who drinks lager anywhere in the world. You’re starting your distribution in the UK, to bars and restaurants, and have decided that your product is a premium lager for those willing-in to pay a little more. This is your SAM. You have some competition as you are unlikely to have a monopoly. The market share you reasonably expect to acquire is your SOM.
TAM = Total lager market
SAM = Premium lager drinkers located in the UK
SOM = your share of those premium lager drinkers
How to calculate your TAM, SAM and SOM
For the most part, you’ll be using the same sources as identified for the Market Opportunity Evidence approach. The trick is being able to find the right figures, that all revolve around one market. More often than not it’s not black and white, and there’s not one report that will give you everything you need.
It’s typically the case you’ll need to do some of your own calculations. Let’s take the example above, and work out the TAM, SAM and SOM.
TAM
It’s was quite simple to find the value of the Lager Market worldwide. It’s $366.94bn as stated in this report. That’s the TAM sorted.
SAM
Getting to the SAM was a little trickier, it wasn’t easy to find the UK lager market size without having to spend lots of money on reports that wouldn’t necessarily give us the answer. However, it’s was easy to find the total annual expenditure on beer in the UK here. It’s £5.6bn. And this report shows that 69% of on-trade beer sold in the UK is lager, and of that 35% is premium lager.
So, my SAM can be calculated as:
(£5.6bn x 69%) x 35%
Making my SAM £1.35bn
It took a little while to figure out (about 30 minutes), but once we’d found a report that stated the market share of lager vs total beer, and premium lager vs all lager, we knew all we needed to find was the total value of beer sold in the UK.
SOM
This is where it’s tempting to over-predict. Founders think they’ll get a much larger share of the market than what is reasonable, which inflates their forecasts and valuations. A little bit of research here – both primary and secondary – will go a long way to make sure your prediction is realistic.
Typically, you wouldn’t expect to see a prediction above 1% market share – unless you have a very good reason.
In our example, this report shows how 48% of the lager market is dominated by three bands. Leaving all the rest to share 52% between them. While this report suggests over 2,500 new beer products have been launched in 5 years. Therefore, a SOM of less than 1% would be realistic, perhaps 0.5% of the market in 5 years is believable.
Note: at this point, we’re guessing and if this were our business, we’d be spending time talking to industry experts to validate this assumption.
However, for the purpose of this example, let’s assume we validate my assumption of 0.5% market share to be realistic. This would make my SOM figure £6,750,000.
The Result
I now have a realistic assumption to present to an investor, one that’s backed up by research and validated by industry experts. I can also use these figures to inform my financial forecast and valuation.
Here’s how it would look in by business plan or pitch deck:
TAM = $367bn (Global lager market)
SAM = £1.35bn (UK spend on premium lager)
SOM = £6.75m (0.5% of premium lager market)
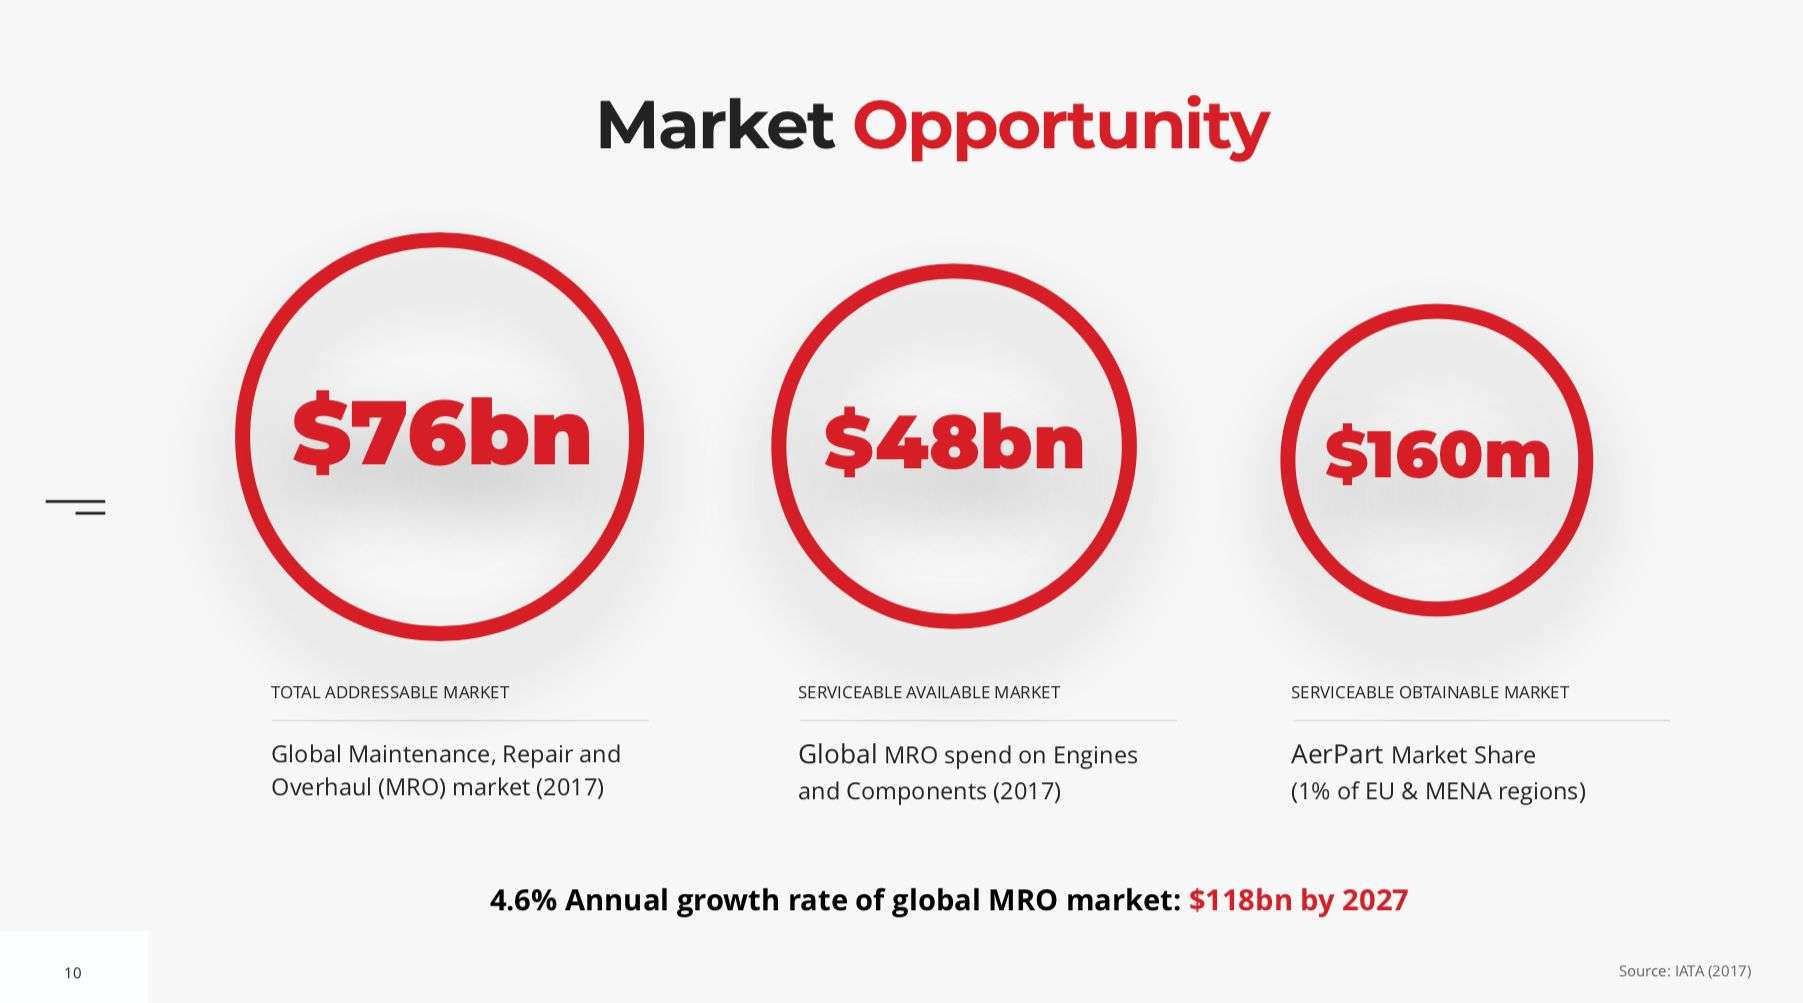
Here’s an example of how your Market Opportunity slide may look with a good and well researched TAM, SAM and SOM approach.
Don’t forget market growth
If you have market growth figures, it’s good to include these too. The Marston’s On Trade Beer Report 2018 suggests a growth rate for premium lager of 3.7% in the UK. It would be wise to show this to your investors so they can see the industry is getting larger year on year.
What happens if my Market Opportunity research goes wrong?
This is the killer question. It can be heartbreaking to do this research and realise the market is too competitive, or the SAM and SOM are just not large enough to support your ambitions.
If this is the case you have a couple of options:
1. Re-consider your market and revenue model
If the market is too small, perhaps you try to find larger markets or find a way to earn more revenue out of the market you have by changing up the revenue model.
In our example of a new lager brand, perhaps sticking to the UK market is not the end game, perhaps we need to launch into the EU and US in years 3 – 5 to reach more scale. Or perhaps we need to consider adding an additional revenue model and move to “off-trade” revenue by bottling the beer and selling into off-licences and retailers for home consumption.
2. Re-consider your product/market fit
Perhaps the harsh truth of the matter is that your product is pitched at a niche that is just too small to support your revenue requirements. It’s better to know this now than in 2 years when you’ve spent millions in R&D.
But this needn’t be the end, it may just mean you need to go back and re-assess your product/market fit.
Perhaps you make your business model work by re-defining the audience. For example, we’ve had a client that started as a B2C model for their app. They soon realised the market was crowded and the numbers didn’t add up.
By shifting to a B2B2C model they were able to offer a free product to the end consumer, by having their employer pay for it. They were the only app targeted in this way that gave them a great competitive advantage. A decent sales pitch and a few meetings with employers soon validated the new approach and led to an investable market opportunity.
In our lager example, we could look at launching craft beers alongside our premium lager in year 3 giving us access to a new market and new revenues.
Recent Posts


Keep up to date with what we’re up to via email


Copyright ©Robot Mascot Ltd. All rights reserved.